How Early-Stage SaaS Founders Measure Thought Leadership as a Revenue Channel
Link thought leadership to pipeline and closed deals, not vanity metrics.

For early-stage SaaS founders, measuring it means connecting the right audience to buying intent, pipeline and closed deals over time.
Why early-stage founders keep measuring thought leadership the wrong way
Founders count impressions, followers and likes because those numbers are easy to find. Yet none establishes a direct link to revenue. A busy feed can sit beside an empty pipeline, while content that quietly shapes a buyer’s shortlist looks unproductive. The dashboard rewards visible activity.
The 6sense 2025 Buyer Experience Report found that buyers who ranked vendors before first contact bought from their early favorite the overwhelming majority of the time. Sales enters a contest already well under way. Content and reputation can help shape that preference before a buyer becomes a recorded opportunity, precisely where standard analytics has little visibility.
A founder who stops at 60 days because “impressions aren't converting” ends the program before the 9–12 week window when sourced demos can appear. The program then looks like a cost center because its evaluation never reaches the commercial evidence.
What thought leadership actually does inside the buying journey
Shortlist formation is the first mechanism. Buyers research founders and their perspectives before speaking to sales, so familiarity can give a vendor a trust advantage at first contact. The Edelman-LinkedIn 2024 B2B Thought Leadership Impact Report found that 75% of decision-makers said thought leadership led them to research a product or service they had not been considering. Content can both open the shortlist and improve a vendor’s position on it.
Deal acceleration is a separate mechanism during active evaluation. A founder whose content has earned trust in the category can make the buyer feel less at risk. There is less ground left to cover. That advantage can reduce objection cycles, shorten negotiations and raise close rates, even when content did not originate the opportunity.
Dark social is the third mechanism, and it travels without a visitor badge. Recommendations from peers in private Slack groups, posts they forward and content they cite in buying committee discussions can bring in warm inbound. Those exchanges need not leave a trackable referral. They also operate on different timelines from shortlist formation and deal acceleration. One undifferentiated “content ROI” number hides these differences.
Why standard attribution models structurally miscount thought leadership pipeline
Last-touch attribution gives credit to the last interaction before conversion. That could be a paid ad, a sales email reply or a newsletter click after months of LinkedIn reading. The final interaction gets the credit by design. Earlier content exposure may have shaped the choice, but it disappears from that model’s account of the sale.
Dark social makes the missing history harder to recover. A buyer might discover a founder through a peer recommendation, read six months of posts and then email sales directly. The CRM records “direct” or “unknown.” Nothing in that label distinguishes a cold arrival from someone already persuaded by the founder’s perspective. A silent reader can be commercially valuable without ever becoming a visible engager.
This makes channels whose clicks are logged look better in the reports. Founders who trust those reports are using an attribution architecture built to recognize interactions that this channel often does not produce.
The practical correction is a self-reported data layer. A “how did you hear about us” question in the demo booking flow or discovery call gives buyers a way to describe the missing history. It supplements digital attribution rather than replacing it, turning an apparently unmeasurable channel into one with incomplete but usable evidence.
The time-lag problem and what it means for which metrics matter at each stage
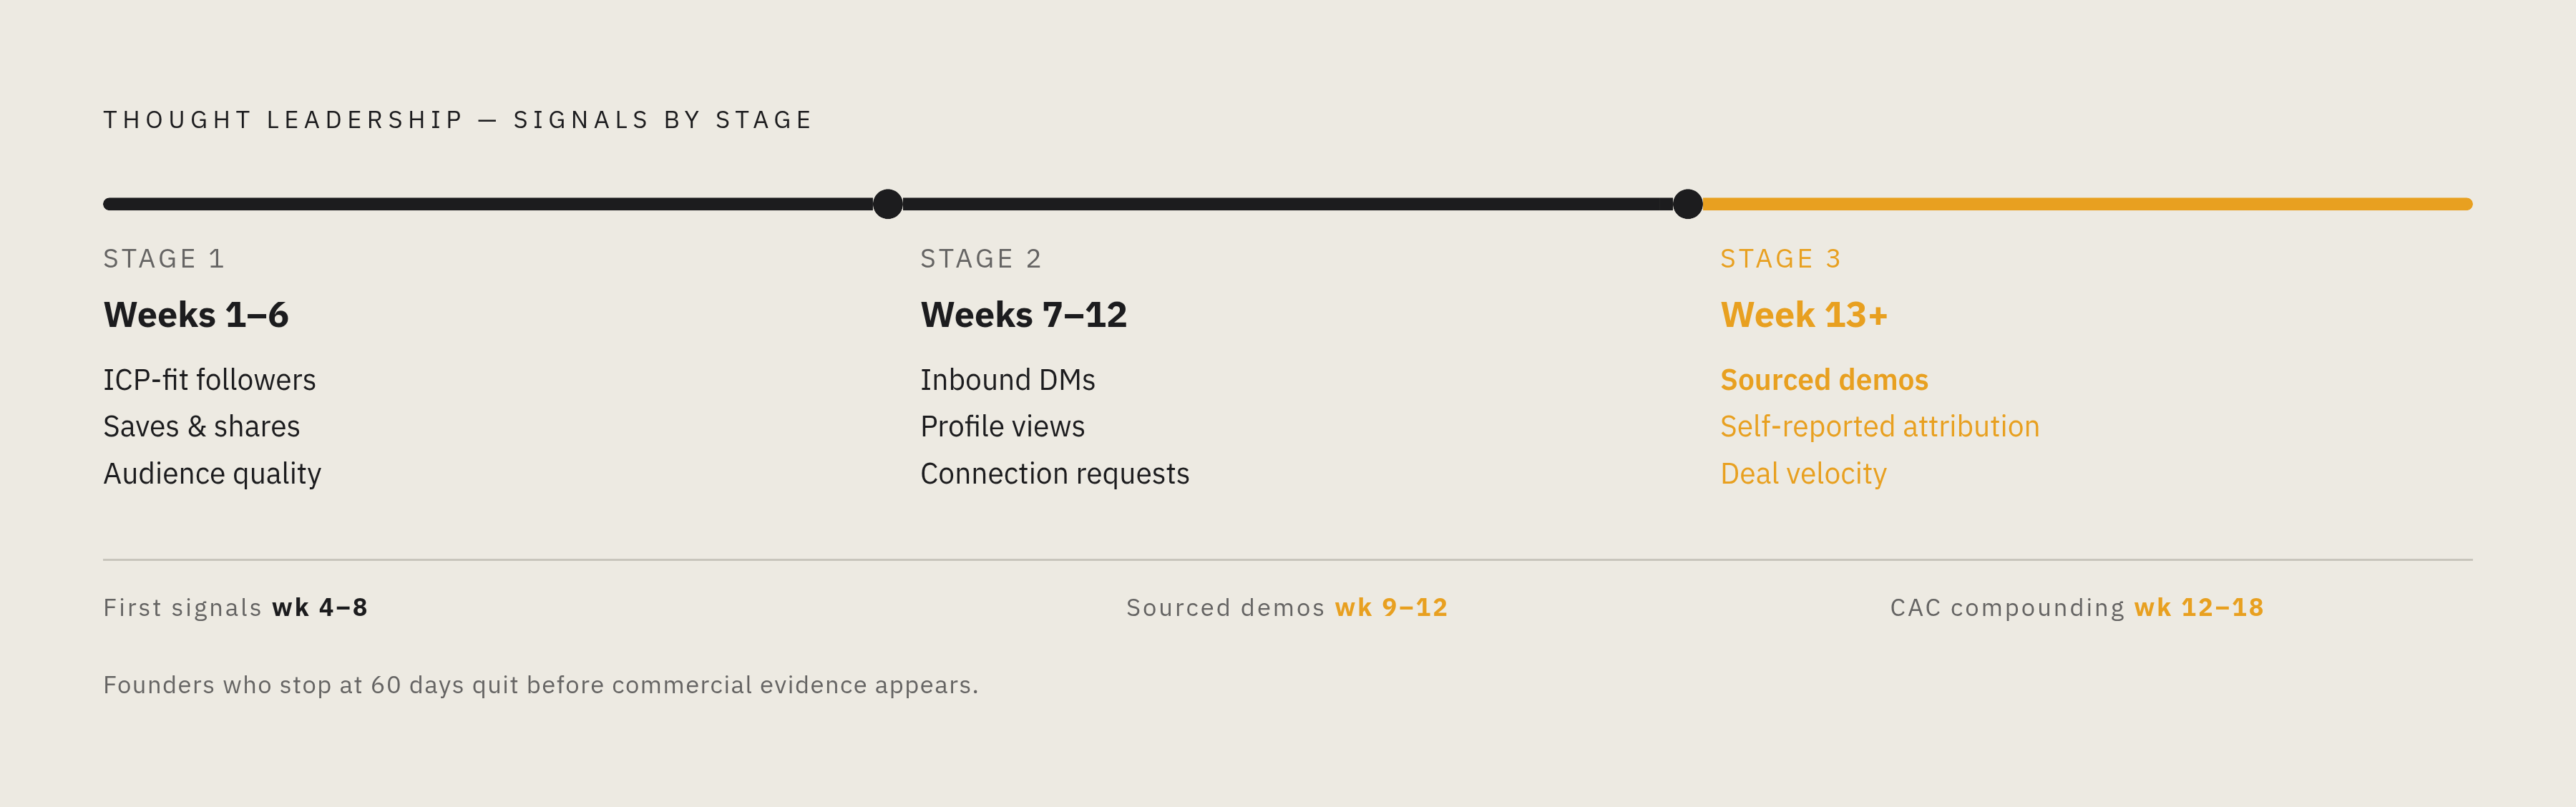
First signals, including impressions and messages citing posts, can appear at 4–8 weeks, while sourced demos appear at 9–12 weeks and compounding effects on customer acquisition cost at 12–18 weeks. These windows give the review a sequence. Looking for sourced pipeline at week 4 asks a late-stage question of an early-stage program.
Stage 1 covers weeks 1–6 and audience quality. Look for people who match the ideal customer profile, or ICP, and who engage, follow or ask to connect. Saves and shares are more useful than likes because they indicate content being kept or passed along. Raw reach cannot tell you who is paying attention.
Stage 2 covers weeks 7–12 and intent. Inbound DMs referencing specific posts, profile views from target accounts and unprompted connection requests from ICP-fit buyers suggest that attention is becoming consideration. These signals precede a buying conversation. They give the program a commercial direction without pretending every interested reader is ready for a demo.
Stage 3 starts at week 13 and looks at sales results. Evidence now includes sourced demos, self-reported attribution, close rates and deal velocity for content-sourced versus outbound leads. The earlier audience and intent signals still help, but now they are only part of the case.
A practical measurement stack for connecting LinkedIn activity to pipeline outcomes
To put that sequence into practice, founders can use four measurement layers, each with its own records and review window.
Layer 1 is audience quality, tracked from week 1. Use LinkedIn native analytics to track how much the follower count grows each week, and check job title and company size for ICP fit. Review commenter profiles and visible profile views from target accounts. Then check new followers and connection requests each week and log ICP fit in a simple spreadsheet. A post with 200 irrelevant likes gives less useful evidence than engagement from the buyers the company serves.
Layer 2 is intent tracking during weeks 6–12. Log every inbound DM referencing a post or topic, with the sender’s company, title and ICP fit. Use LinkedIn Sales Navigator, if available, or manually review “who viewed your profile” each week for named target accounts. Keep a “content-sourced conversation” log for introductory or discovery calls where prospects mention the founder’s content. Specific references make these records useful. They connect activity to a person and a conversation.
Layer 3 is pipeline attribution from week 12 onward. Add a mandatory “how did you hear about us” field to demo booking forms and include the question in discovery call scripts. Tag an opportunity “content-influenced” when the buyer names content as an entry point or references specific posts during the call. Keep that tag beside standard attribution. Compare the deal velocity and close rates of opportunities that are content-influenced with those that are non-content-influenced. This separates evidence of deal acceleration from evidence that content started the relationship.
Layer 4 is ongoing revenue influence, reviewed quarterly. Record how much content-influenced pipeline was created and closed, the average deal size and how close rates differ between cohorts. Keep a separate log of revenue-adjacent outcomes for investors who show interest and candidates who apply and cite founder content. For the program’s revenue-to-investment calculation, divide revenue from closed content-influenced deals by content production cost plus founder time at an imputed hourly rate. Founder time belongs in the denominator too. This gives a measured return to weigh when deciding how much to spend on the channel, even without perfect attribution.
The ICP-specificity test for reaching people who buy
The stack needs an audience quality check. Strong engagement from people who will never buy is a vanity metric with extra steps, and it makes later pipeline analysis noisy. For that reason, the practical test is to review the top 10–15 engagers after each post. Check what percentage hold relevant titles at companies matching the ICP, then log that as “ICP engagement rate” separately from raw engagement.
If raw engagement is high but ICP engagement is low, the topic mix needs attention before the tracking system does.
What a 90-day measurement review actually looks like in practice
At 30 days, review who has arrived. Count net new ICP-fit followers and connection requests, then inspect any inbound DMs from those profiles. Compare the ICP engagement rate of opinion posts, tactical breakdowns, behind-the-scenes posts and category narratives. Choose next month’s mix of topics based on what matters to buyers, giving that more weight than raw reach. Record current profile views from target accounts as the baseline for month 2.
At 60 days, check whether attention is turning into intent. Total the inbound DMs referencing content and the content-sourced conversations logged by the founder or sales team. Compare target-account profile views with the 30-day baseline. Then check whether any content-influenced conversations have entered the CRM and inspect their self-reported attribution. Even one or two records begin to clarify the path. An empty closed-revenue column does not erase that evidence.
At 90 days, review the pipeline as a whole. Report the number and value of content-influenced opportunities, their distribution across sales stages, and their close rates and deal velocity against non-content-influenced pipeline. Review every discovery-call attribution response from the quarter and calculate the percentage citing thought leadership or founder content as an entry point. This is where the separate logs meet. They show both what buyers say brought them in and what happened after arrival.
The financial review also looks at closed content-influenced revenue divided by what was invested in the 90-day program, alongside paid-channel CAC for the same period, treating each as a distinct measure. Investor inbound, recruiting inbound and partnership conversations that came from people seeing the content belong in a separate revenue-adjacent record. They enrich the evaluation without inflating the sales pipeline.
The decision then depends on which evidence is missing. Low ICP engagement and zero content-influenced conversations point to a strategy problem involving topics or audience. Strong ICP signals without CRM tagging point to attribution hygiene. Those failures need different fixes. Treating both as “LinkedIn doesn't work” discards the diagnosis the review was built to provide.
Where the measurement framework breaks down and how to handle the gaps
Private influence will still escape this system. Peer Slack groups, forwarded posts, internal buying discussions and AI-generated shortlists can shape decisions without leaving a referrer or trackable click. Self-reported attribution helps but cannot close every gap. The measured content-influenced pipeline is therefore a floor.
That limit does not justify inventing the missing revenue. It calls for using the measured figure as the conservative case while allowing for influence the records miss. The objection that only precisely measurable activity deserves credit confuses visibility with value. Word-of-mouth and peer recommendations do not become commercially irrelevant because they decline to fill in a tracking form.
The practical response is to track observable signals rigorously and supplement them with what buyers report. The minimum viable evidence bar is clear. If the 90-day review shows strong ICP engagement, inbound DMs from ICP-fit buyers and at least a handful of self-reported content attributions from discovery calls, the program is working even if CRM attribution remains small.