Customer Surveys and Feedback Systems for B2B SaaS Retention
Survey data only predicts churn when you act on it before the renewal conversation starts.
Customer surveys don't save B2B SaaS accounts on their own; what happens after the survey does more of the work. Most companies treat feedback collection as the finish line when it's actually the starting gun, and that one mistake is quietly costing them renewals they never saw coming.
Here's the math nobody wants to say out loud: a typical B2B SaaS customer pays you somewhere between 5% and 15% of their total lifetime value upfront, according to CustomerGauge. The other 85% to 95% is sitting out there, unrealized, waiting on a renewal decision that hasn't happened yet. That's not a small footnote, but the whole business model, exposed and hanging out to dry until someone signs again.
Where the B2B SaaS retention baseline actually stands in 2025
Recurly's 2025 analysis puts median annual churn at 3.5%, and anything under 5% annually puts you in decent shape, relatively speaking. Yet "decent" depends entirely on who you're comparing yourself to, because churn splits hard by segment: SMB churn runs 3–5% monthly, mid-market sits at 1.5–3%, and enterprise holds at a tight 1–2%. Compare an SMB number to an enterprise benchmark and you'll either panic unnecessarily or celebrate a number that should worry you.
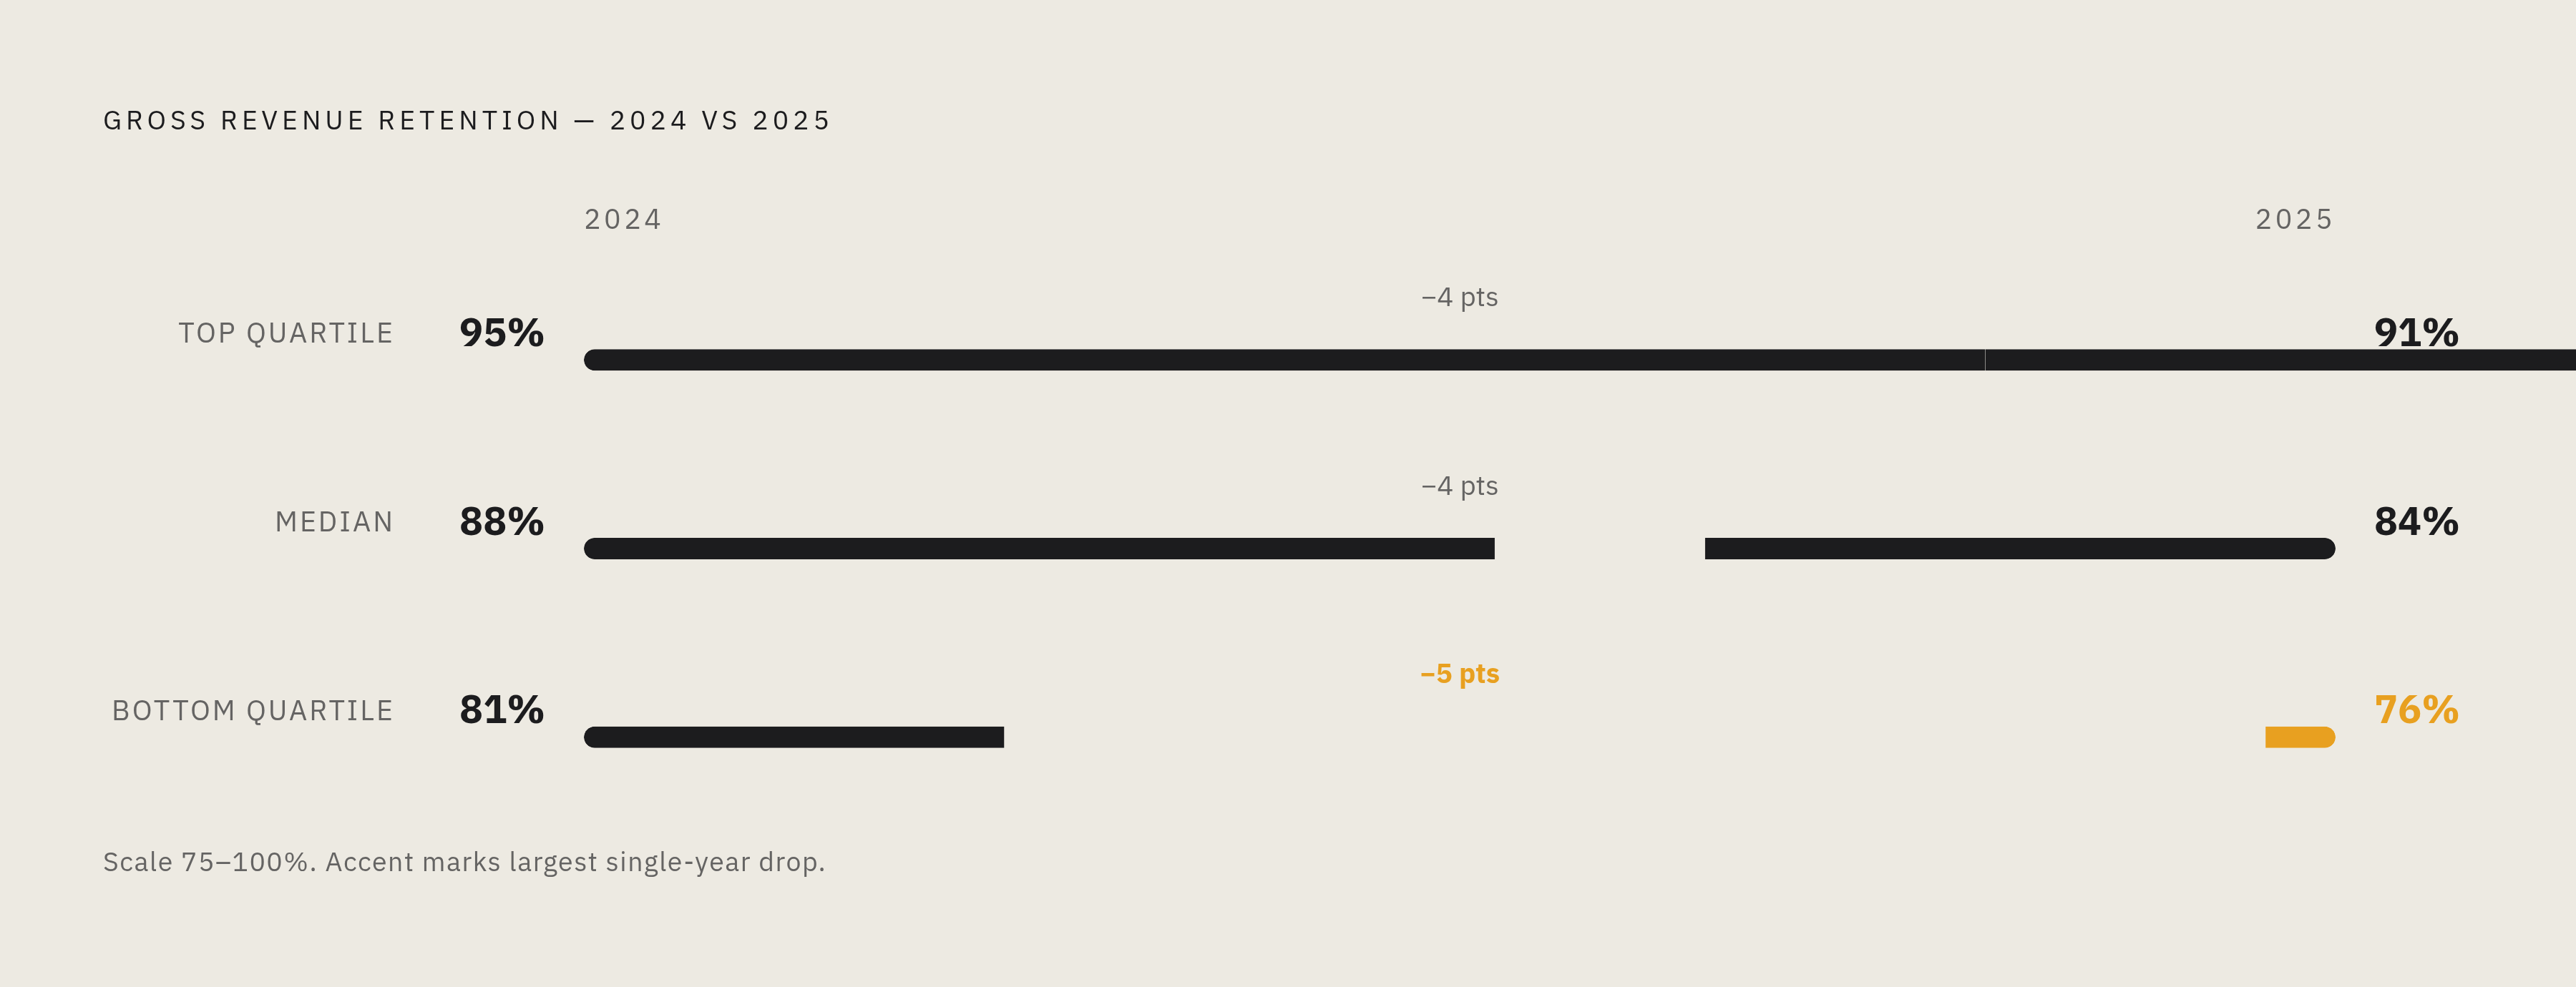
The uglier trend is what's happening to gross revenue retention. Median GRR dropped from 88% to 84% between 2024 and 2025, top-quartile companies fell from 95% to 91%, and bottom-quartile slid from 81% down to 76%. Everyone's losing ground, just at different speeds.
Contract length is doing a lot of quiet work here too. Monthly contracts churn at roughly 18%, while two-year agreements churn at about 8%. That's a structural lever separate from your feedback system, and it either amplifies or cancels out whatever your survey program is doing, which is worth remembering before you credit (or blame) your NPS program for something your billing terms actually caused.
Meanwhile, there's the macro backdrop: in 2024, new B2B SaaS sales dropped 3.3%, but churn also fell 3.3%. In a tighter market, buyers get more careful about leaving, which means retention becomes less of a nice-to-have metric and more of the primary way revenue gets defended. Put it together and you get an uncomfortable truth: "average" retention in 2025 is worse than "average" was in 2024, even if your own number hasn't moved. Standing still is technically falling behind.
The three survey types that cover the retention signal space and when to use each
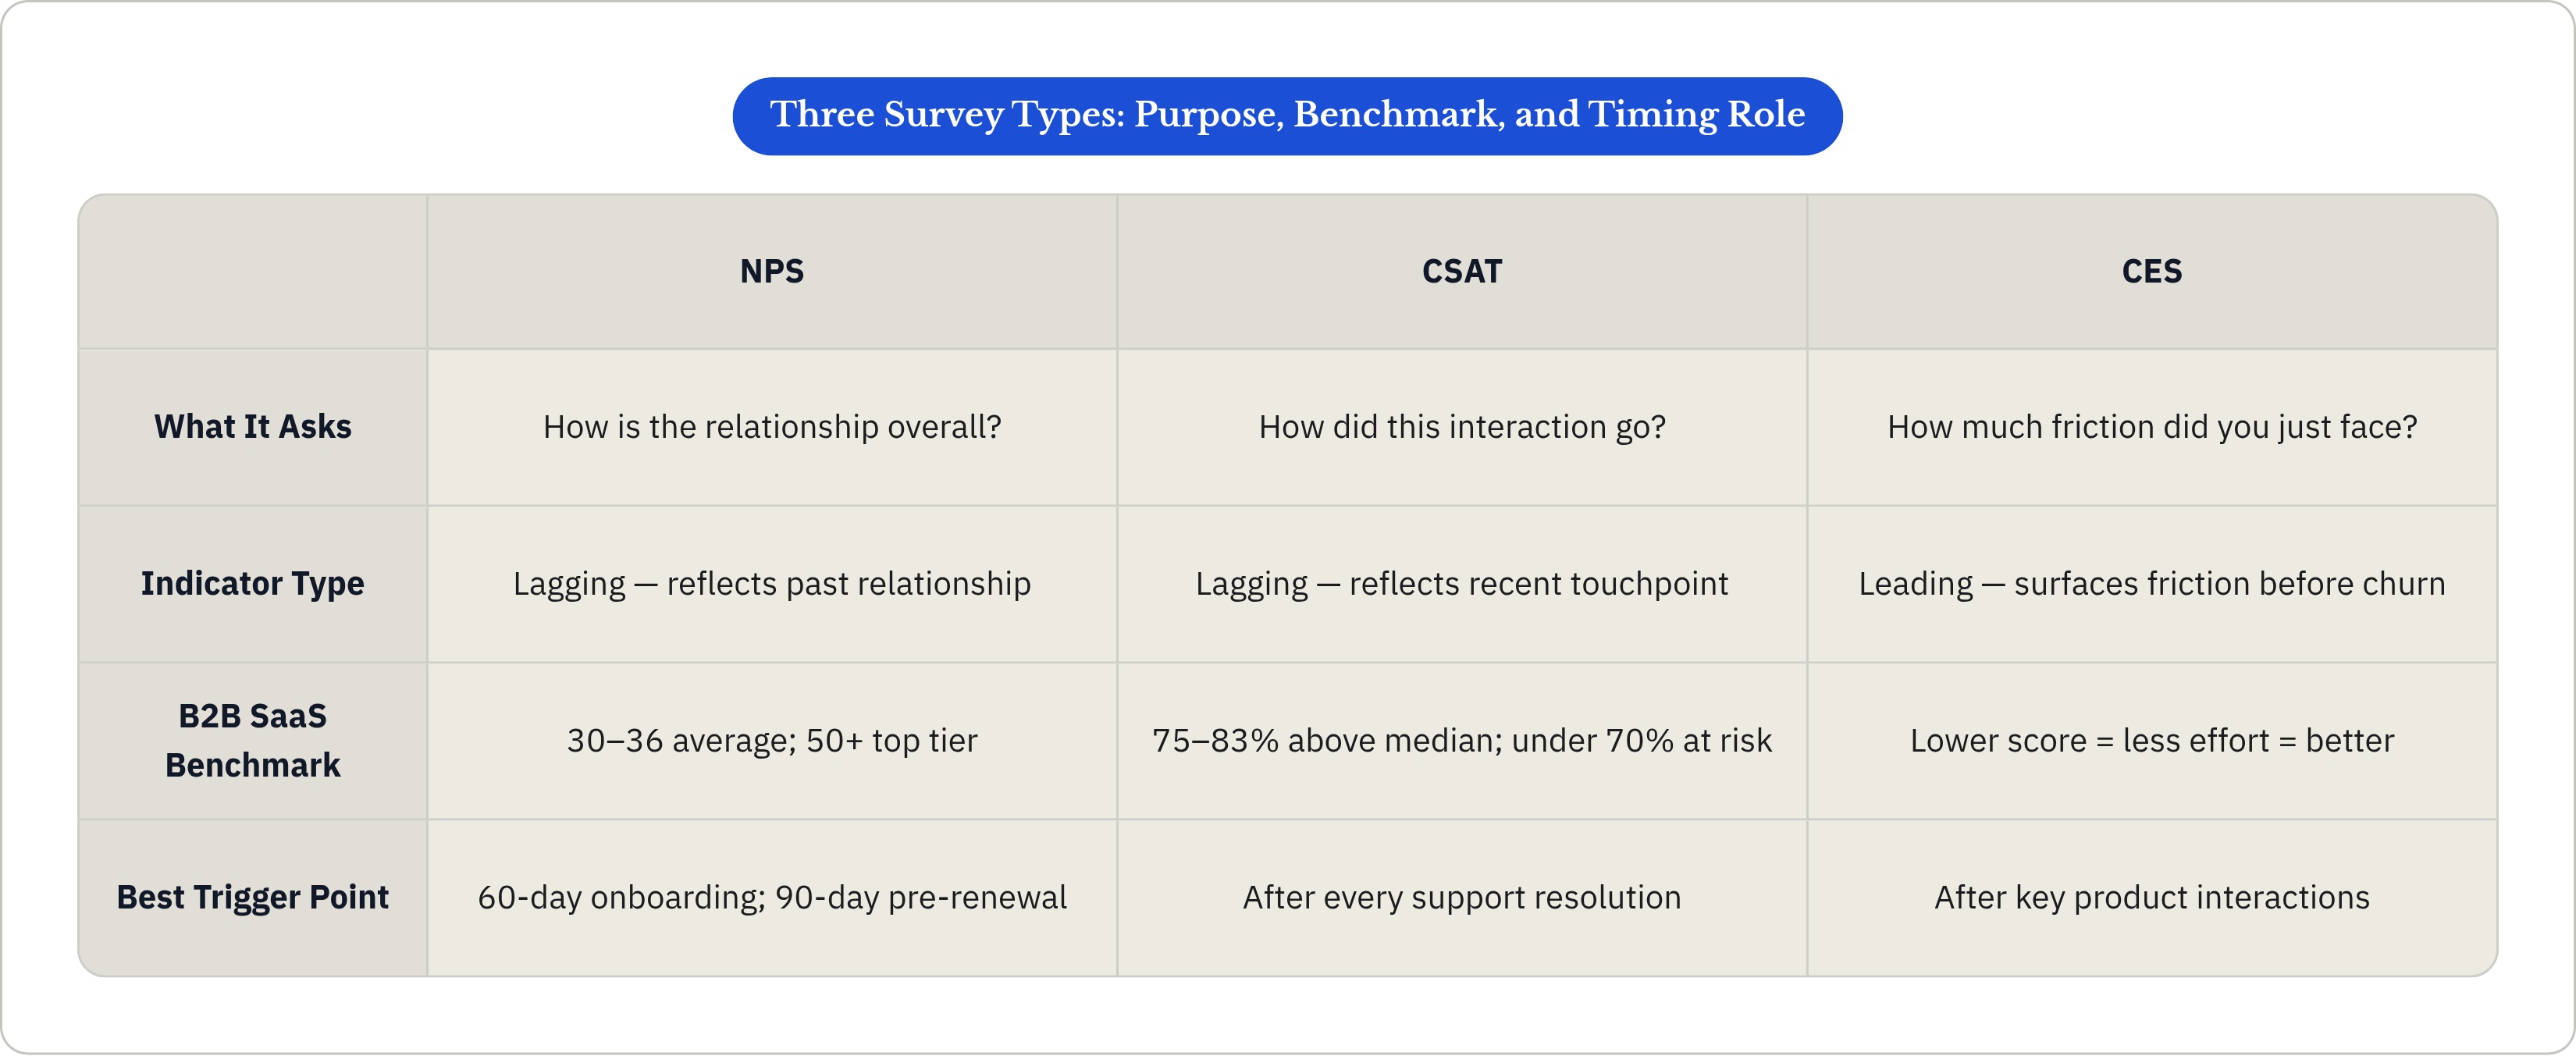
There are three tools in this kit, and each one answers a different question. NPS asks how the relationship is doing overall. CSAT asks how a specific interaction went. CES asks how much friction the customer just fought through. Use only one, and you're covering maybe a third of the picture.
NPS benchmarks for B2B SaaS run 30–36 as industry average, 40+ as above average, 50+ as top tier, and 70+ as genuinely rare air. Enterprise software tends to skew high, averaging around 44, mostly because enterprise relationships run deeper and longer, with more people invested in the vendor working out. CSAT has its own bar: 75–83% counts as above-median, and anything under 70% puts you at a real competitive disadvantage, and a meaningful one at that.
The distinction that actually matters: NPS is a lagging indicator that tells you how the relationship has been, while CES is a leading indicator that tells you where friction is building before that friction turns into a cancellation. Relying on NPS alone means you're reading yesterday's newspaper.
Here's the uncomfortable reality: research consistently shows that most unhappy customers never complain directly. They don't file a ticket, they don't reply to your check-in email, they just quietly start shopping. So proactive survey cadence isn't optional if you want to surface that silent dissatisfaction before those customers leave silently too.
Channel matters more than most people think. SMS surveys pull 40–50% response rates, in-app surveys land at 20–35%, and linked email trails at 10–18%. If you're a SaaS company, in-app placement usually wins on more than just response rate. It ties the feedback to an actual moment in the product, which makes the data far more actionable than "some guy replied to an email three weeks after using your dashboard."
How timing and lifecycle triggers turn surveys from snapshots into early-warning signals
An NPS survey fired off at a random Tuesday is market research, while an NPS survey fired off at a predictable relationship milestone is an early-warning system. Same question, wildly different value, depending entirely on when you ask it.
The trigger points that matter most:
- Post-onboarding, around 30–60 days in, to catch friction before it hardens into habit
- The six-month mark, to surface dissatisfaction before it reaches renewal-conversation territory
- The pre-renewal window, 60–90 days out, so CS actually has runway to do something with what they hear
- Right after support resolution, where CSAT tells you whether that ticket rebuilt trust or quietly torched it
- After a major product update, to see if customers experienced it as an upgrade or an unwelcome surprise
Here's the logic underneath all of it: churn decisions in B2B SaaS rarely happen at the renewal meeting. They happen three to six months earlier, in someone's head, and get rationalized out loud when the contract actually comes up. Lifecycle triggers exist to catch that decision while it's still forming, before it's already been made and dressed up in a polite excuse.
Sentiment data on its own is half a diagnosis. Pair every trigger point with actual usage data, login frequency, feature adoption, whatever your product analytics already track, because a customer who says "fine" but hasn't logged in for three weeks is telling you two different stories at once. A word of caution, though: over-surveying is its own failure mode. Ask too often without a clear purpose behind each ask, and you train customers to ignore you entirely. Every survey needs one defined question and one defined action waiting on the other side.
Customer health scoring as the connective tissue between survey data and CS action
A survey score flags that something's wrong, while a health score adds how wrong, which account needs attention first, and how fast. That's the whole difference between a data point and a decision-making tool.
The inputs that build a real health score:
- Product adoption: login frequency, feature depth, how widely the tool is used across the account, not just by one champion
- Engagement signals: webinar attendance, support ticket volume and tone, whether anyone shows up to QBRs
- Satisfaction trends: NPS and CSAT tracked over time, not a single snapshot pulled from last quarter
- Commercial health: MRR trajectory, upsell history, whether invoices get paid on time or chased down monthly
Weight this carefully, since adoption and engagement are leading indicators while satisfaction scores are lagging. By the time NPS actually drops, the churn decision may already be baked in. Companies using structured health scoring see NRR lift of 6 to 12 points, especially in mid-market SaaS, and the mechanism is earlier intervention rather than more intervention, the same amount of CS effort, applied sooner, on the right accounts.
One design rule that gets skipped constantly: the score needs thresholds that automatically trigger CS workflows. A health score that just sits on a dashboard, admired quietly by nobody, is decoration, and it's not doing its job until it forces someone to act.
Closing the loop: turning survey responses into interventions that accounts can see
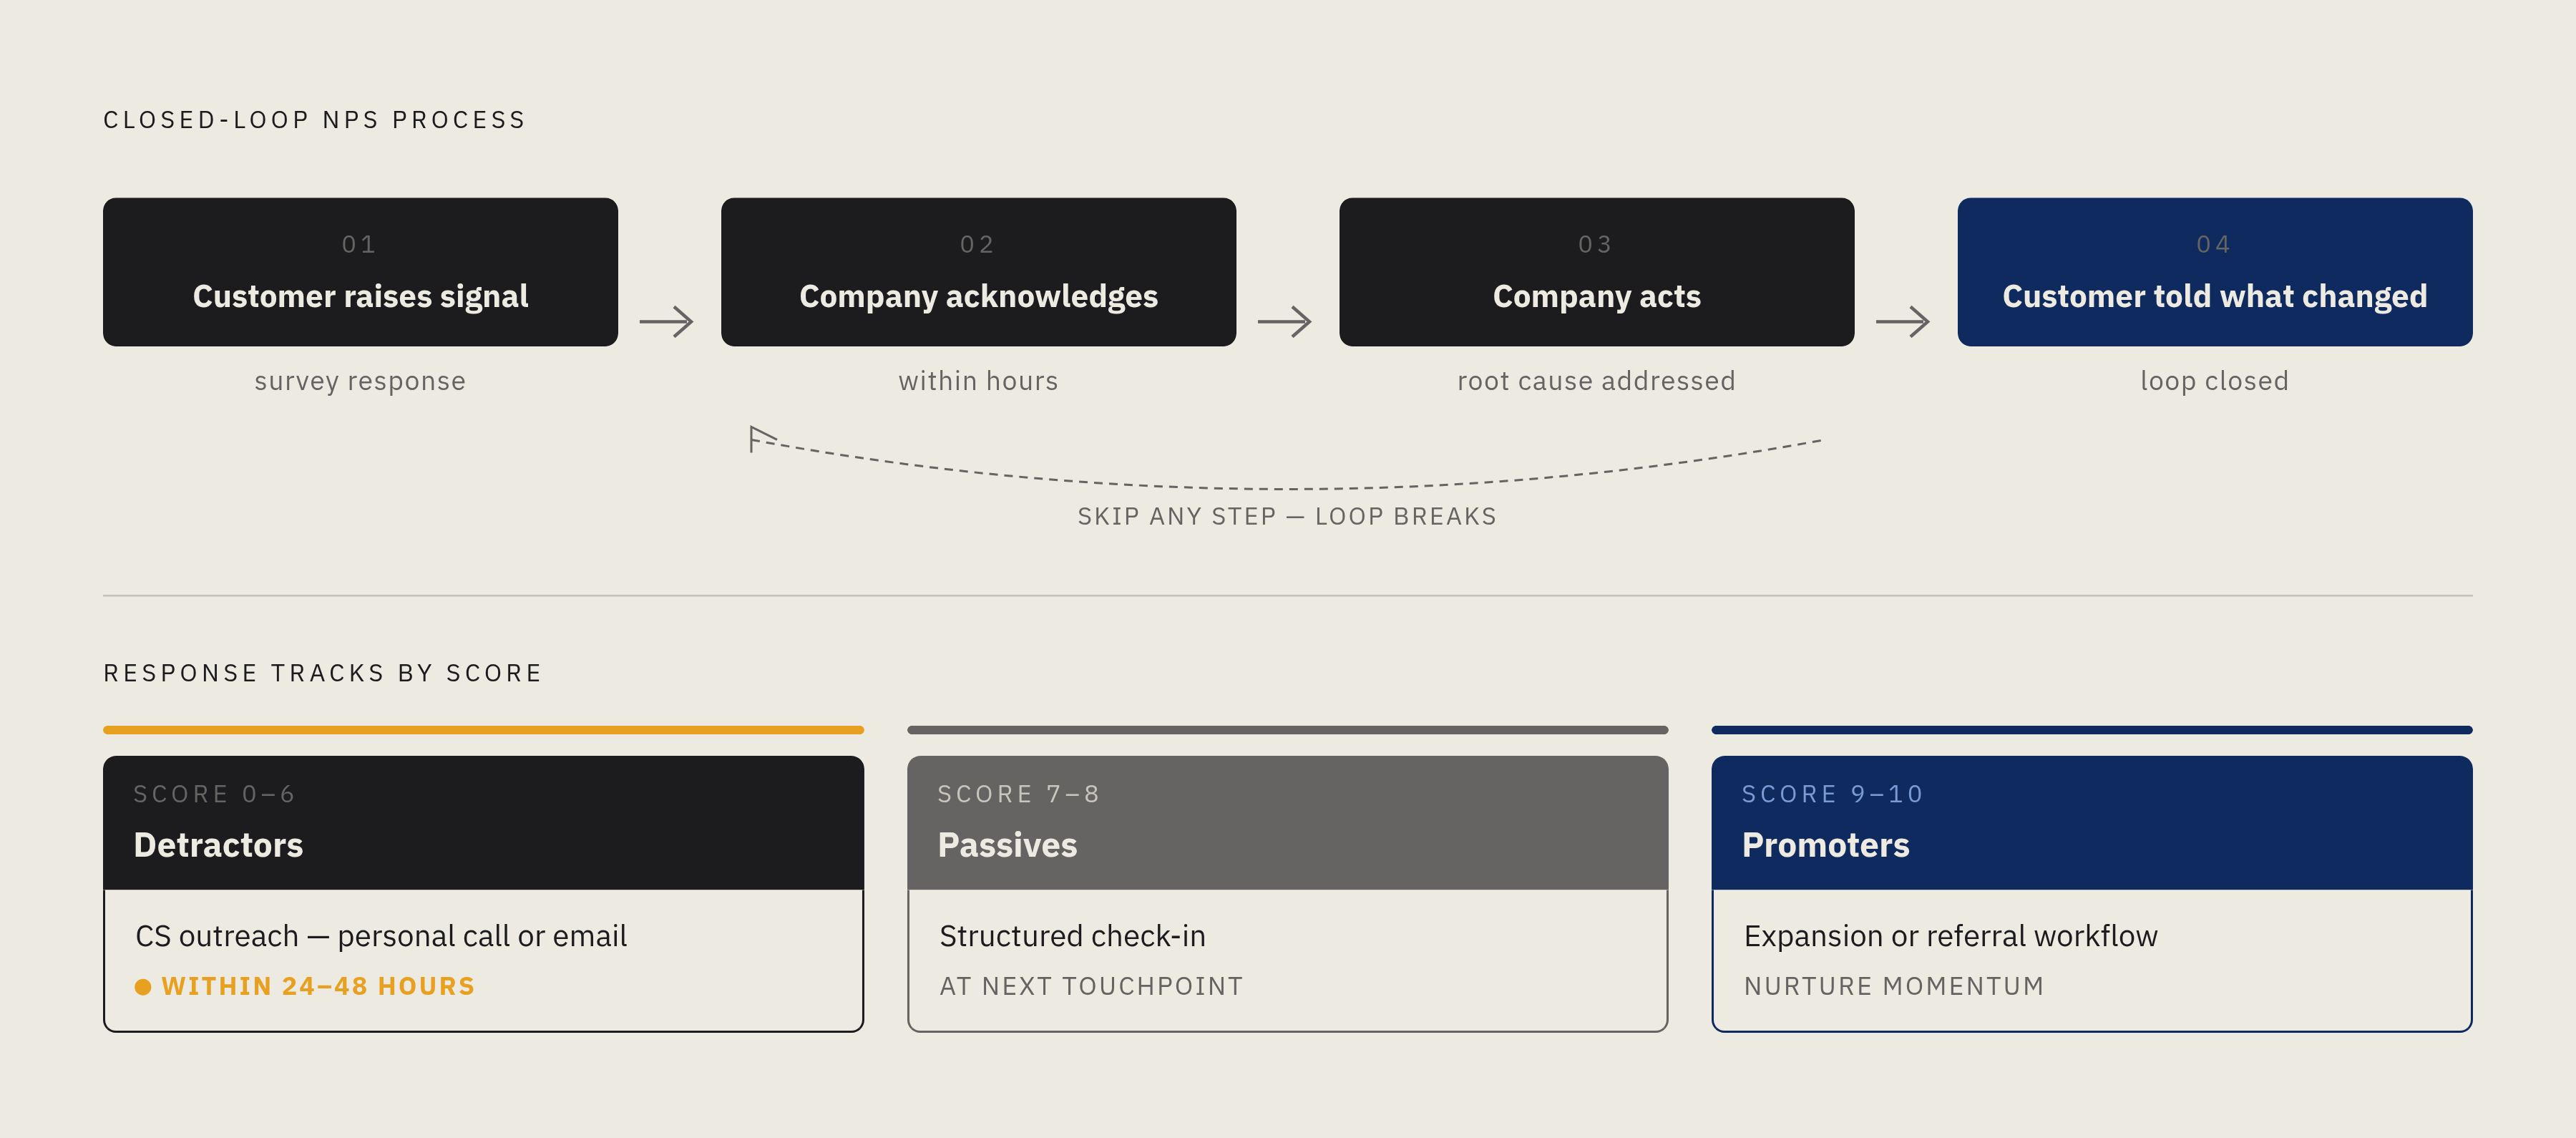
Closed-loop feedback has four steps: the customer raises a signal, the company acknowledges it, the company acts on it, and the company tells the customer what changed. Skip any one of those four and the whole loop breaks, and a broken loop is arguably worse than no survey at all.
Speed is the leverage point most companies underrate. Responding to a detractor signal within 48 hours can meaningfully lift retention, according to Innovation Visual. Urgency here is a design requirement baked into the process, not a nice-to-have. Organizations running true closed-loop systems report three times the promoters showing up in their next survey cycle, and the interesting part is that the follow-up itself does more conversion work than the actual fix does, because people just want to know someone heard them.
The operational breakdown by score:
- Detractors (0–6): CS outreach within 24–48 hours, aimed at understanding root cause before it turns into a formal cancellation conversation
- Passives (7–8): a structured check-in at the next natural touchpoint, aimed at figuring out what would actually move them up
- Promoters (9–10): routed into an expansion or referral workflow, because retention's already solid here and the opportunity is growth, not rescue
A survey that goes nowhere doesn't just waste time, it actively damages the relationship. It tells the customer their input landed in a void, which accelerates disengagement rather than preventing it. Even exit surveys can be closed-loop tools: paired with a targeted retention offer, they give you one last opportunity to address the root cause. Even the customer walking out the door is still worth listening to.
The NRR compounding effect: how consistent feedback loops build a measurable retention curve
Here's the chain, laid out plainly: consistent survey cadence catches early churn signals, which triggers CS intervention, which saves and expands accounts, which lifts NRR, which accelerates the whole growth curve. Each link depends on the one before it actually working.
NRR above 100% means the business grows without signing a single new logo. The relationship between NRR improvement and overall growth is exponential, not linear, meaning small NRR gains compound into disproportionately large outcomes over time. The 2024 KeyBanc/Sapphire Ventures survey of roughly 100 private SaaS companies found average NRR sitting around 101%, a useful line in the sand for what "functionally fine" looks like at scale.
Top-performing B2B SaaS companies generate over 50% of new ARR from upsells alone. That kind of expansion revenue only comes from accounts that are retained, satisfied, and paying attention, which means it only happens when the feedback infrastructure behind it is actually running. Average annual retention across B2B SaaS sits at 74%, and the gap between average and elite performance is explained almost entirely by expansion revenue, downstream of retention quality that started with someone answering a survey honestly. NRR is the output variable the whole feedback system should be built to optimize, more than it is simply a metric to report to the board.
What the feedback system reveals that founders can turn into GTM and investor narrative
A working feedback system accumulates something no competitor can copy: first-party insight into exactly where your customers hurt, where the product creates friction, and where value actually lands. That's proprietary data, sitting quietly in your support tickets and survey responses, mostly unused.
Founders who mine it well can build genuinely opinionated content, grounded in real operational evidence rather than recycled industry platitudes. There's room to do that well, because most thought leadership is mediocre and fails to impress the decision-makers who consume it. That's a low bar to clear, and clearing it matters more than people assume. Founders who do clear it earn the kind of credibility that can put competitor accounts back in play, whether those competitors like it or not.
For fundraising, an NRR trajectory backed by a documented feedback system tells a story, beyond just a number. It shows investors the improvement was engineered on purpose, rather than a happy accident that showed up in the numbers one quarter. And the 2–3x valuation multiple gap between low-churn and high-churn SaaS companies means this output is directly visible to anyone doing due diligence; they will find it, so it might as well work in your favor. Anonymized customer verbatims, aggregated across accounts, make for credible content raw material too. They prove you understand your market at the account level, not just at the tidy, generic segment level everyone else writes about. Founders publishing real retention insight are quietly running top-of-funnel marketing and customer signaling at the same time, reaching buyers who hadn't previously considered them.
The minimum viable feedback system for a B2B SaaS company that doesn't yet have one
The most common failure isn't the absence of surveys, but the absence of anything happening after the survey gets sent. Starting simple, with a working action layer from day one, beats starting complex with an action layer bolted on later as an afterthought.
The minimum stack looks like this:
- One NPS survey at 60 days post-onboarding, another at 90 days pre-renewal
- One CSAT survey fired after every support resolution, no exceptions
- A written response protocol for detractors: who owns the outreach, what the timeframe is, what the objective of that conversation actually is
- A lightweight health score built from two or three usage signals you probably already have sitting in your product analytics
- A monthly review of score trends by segment, focused on directional patterns, not individual tickets
Get the response protocol solid before you expand survey coverage. A system that reliably responds to 20 signals beats a system that collects 100 signals and quietly does nothing with 99 of them. Tooling is secondary here, and worth saying plainly: this loop can run out of a CRM with a person manually following up. Generating retention value this way doesn't require a dedicated CS platform, just someone who owns the follow-up and actually does it.
As the system matures, the data it collects becomes the foundation for sharper health scoring, real expansion playbooks, and the kind of credible operational story that separates a strong investor pitch from a deck full of hopeful projections. It starts small, it compounds, and unlike most things in SaaS, it gets easier to defend the longer you run it.