Account-Based Marketing Plan Template for B2B Teams
B2B teams running ABM without a structured plan leave pipeline on the table.

Most B2B companies already run some kind of ABM. Somewhere between 76 and 94% do, depending on which benchmark you trust, but fewer than 20% have it built into how they actually operate day to day. Only 29% call their program fully optimized. That gap is the whole story: everyone's busy, and busy rarely turns into pipeline.
The root cause is almost always the same one. Somebody built a spreadsheet of target accounts, called it a strategy, and moved on. A real ABM plan connects five things: who you're targeting, how you rank them, who inside each account actually signs off, what you say to each of them and where you say it, and how you'll know any of it worked. Skip a layer and the whole thing wobbles like a table with one short leg.
This piece walks through each layer, with a template component you can steal and fill in yourself.
The five components every ABM plan must define before any outreach begins
Five things need to exist before a single email goes out or a LinkedIn ad runs: your ICP and buying committee definition, account tiering, entry criteria that trigger action, a channel and content plan by tier, and a way to measure what's actually happening in pipeline.
These aren't steps you check off in order and forget about. A weak ICP poisons your tiering, since you're ranking accounts against a target that's basically a shrug. Sloppy tiering then limits what you can do on the channel side, because nobody has the headcount to write bespoke outreach for 400 accounts. And if your measurement only tracks activity, you'll never find out which layer actually broke when a deal stalls in month five.
About 28% of marketing budgets now go toward ABM. At that spend level, half a plan is just an expensive way to generate dashboards nobody trusts.
Defining the ICP with enough precision to actually select accounts
Start here. Everything else depends on it. "Enterprise SaaS companies with 500+ employees" is a demographic sketch, not a target list, and demographic sketches don't tell your SDR who to call on a Tuesday morning.
A usable ABM ICP runs through four filters:
- Firmographic: industry, headcount, revenue band, geography, tech stack signals
- Situational: growth stage, recent funding, hiring patterns, the product category they're already buying into
- Behavioral: intent data, the content they're reading, conference badges, the searches they're actually running
- Pain architecture: the specific operational problem they're solving right now, in this exact buying window
That last one gets skipped constantly. It's also the one that predicts whether an account moves at all.
There's a scale problem most ICP definitions ignore too. Data from digitalapplied.com puts the median buying group for deals over a certain size at 11.2 people in 2025, up from 9.7 a year earlier. If your ICP only describes the economic buyer, you've defined maybe a tenth of the account.
Template component: ICP definition worksheet. Split firmographics into must-haves and nice-to-haves. List the situational triggers that mean a buying window is actually open. Map the roles you need to find in every account (economic buyer, technical evaluator, champion, blocker). Then write down your disqualifiers, the traits that knock an account out no matter how shiny the surface fit looks.
One mistake keeps showing up: building the ICP entirely off your current customer list, without checking which of those customers actually stuck around and expanded versus quietly churned. Some of your best-looking logos are on their way out the door. Modeling your next 200 target accounts on the wrong 20 is a great way to lose slower.
How to tier target accounts so resources concentrate where they convert
Tiering is triage. You're deciding, ahead of time, where your team's limited hours actually go.
The standard model runs three tiers:
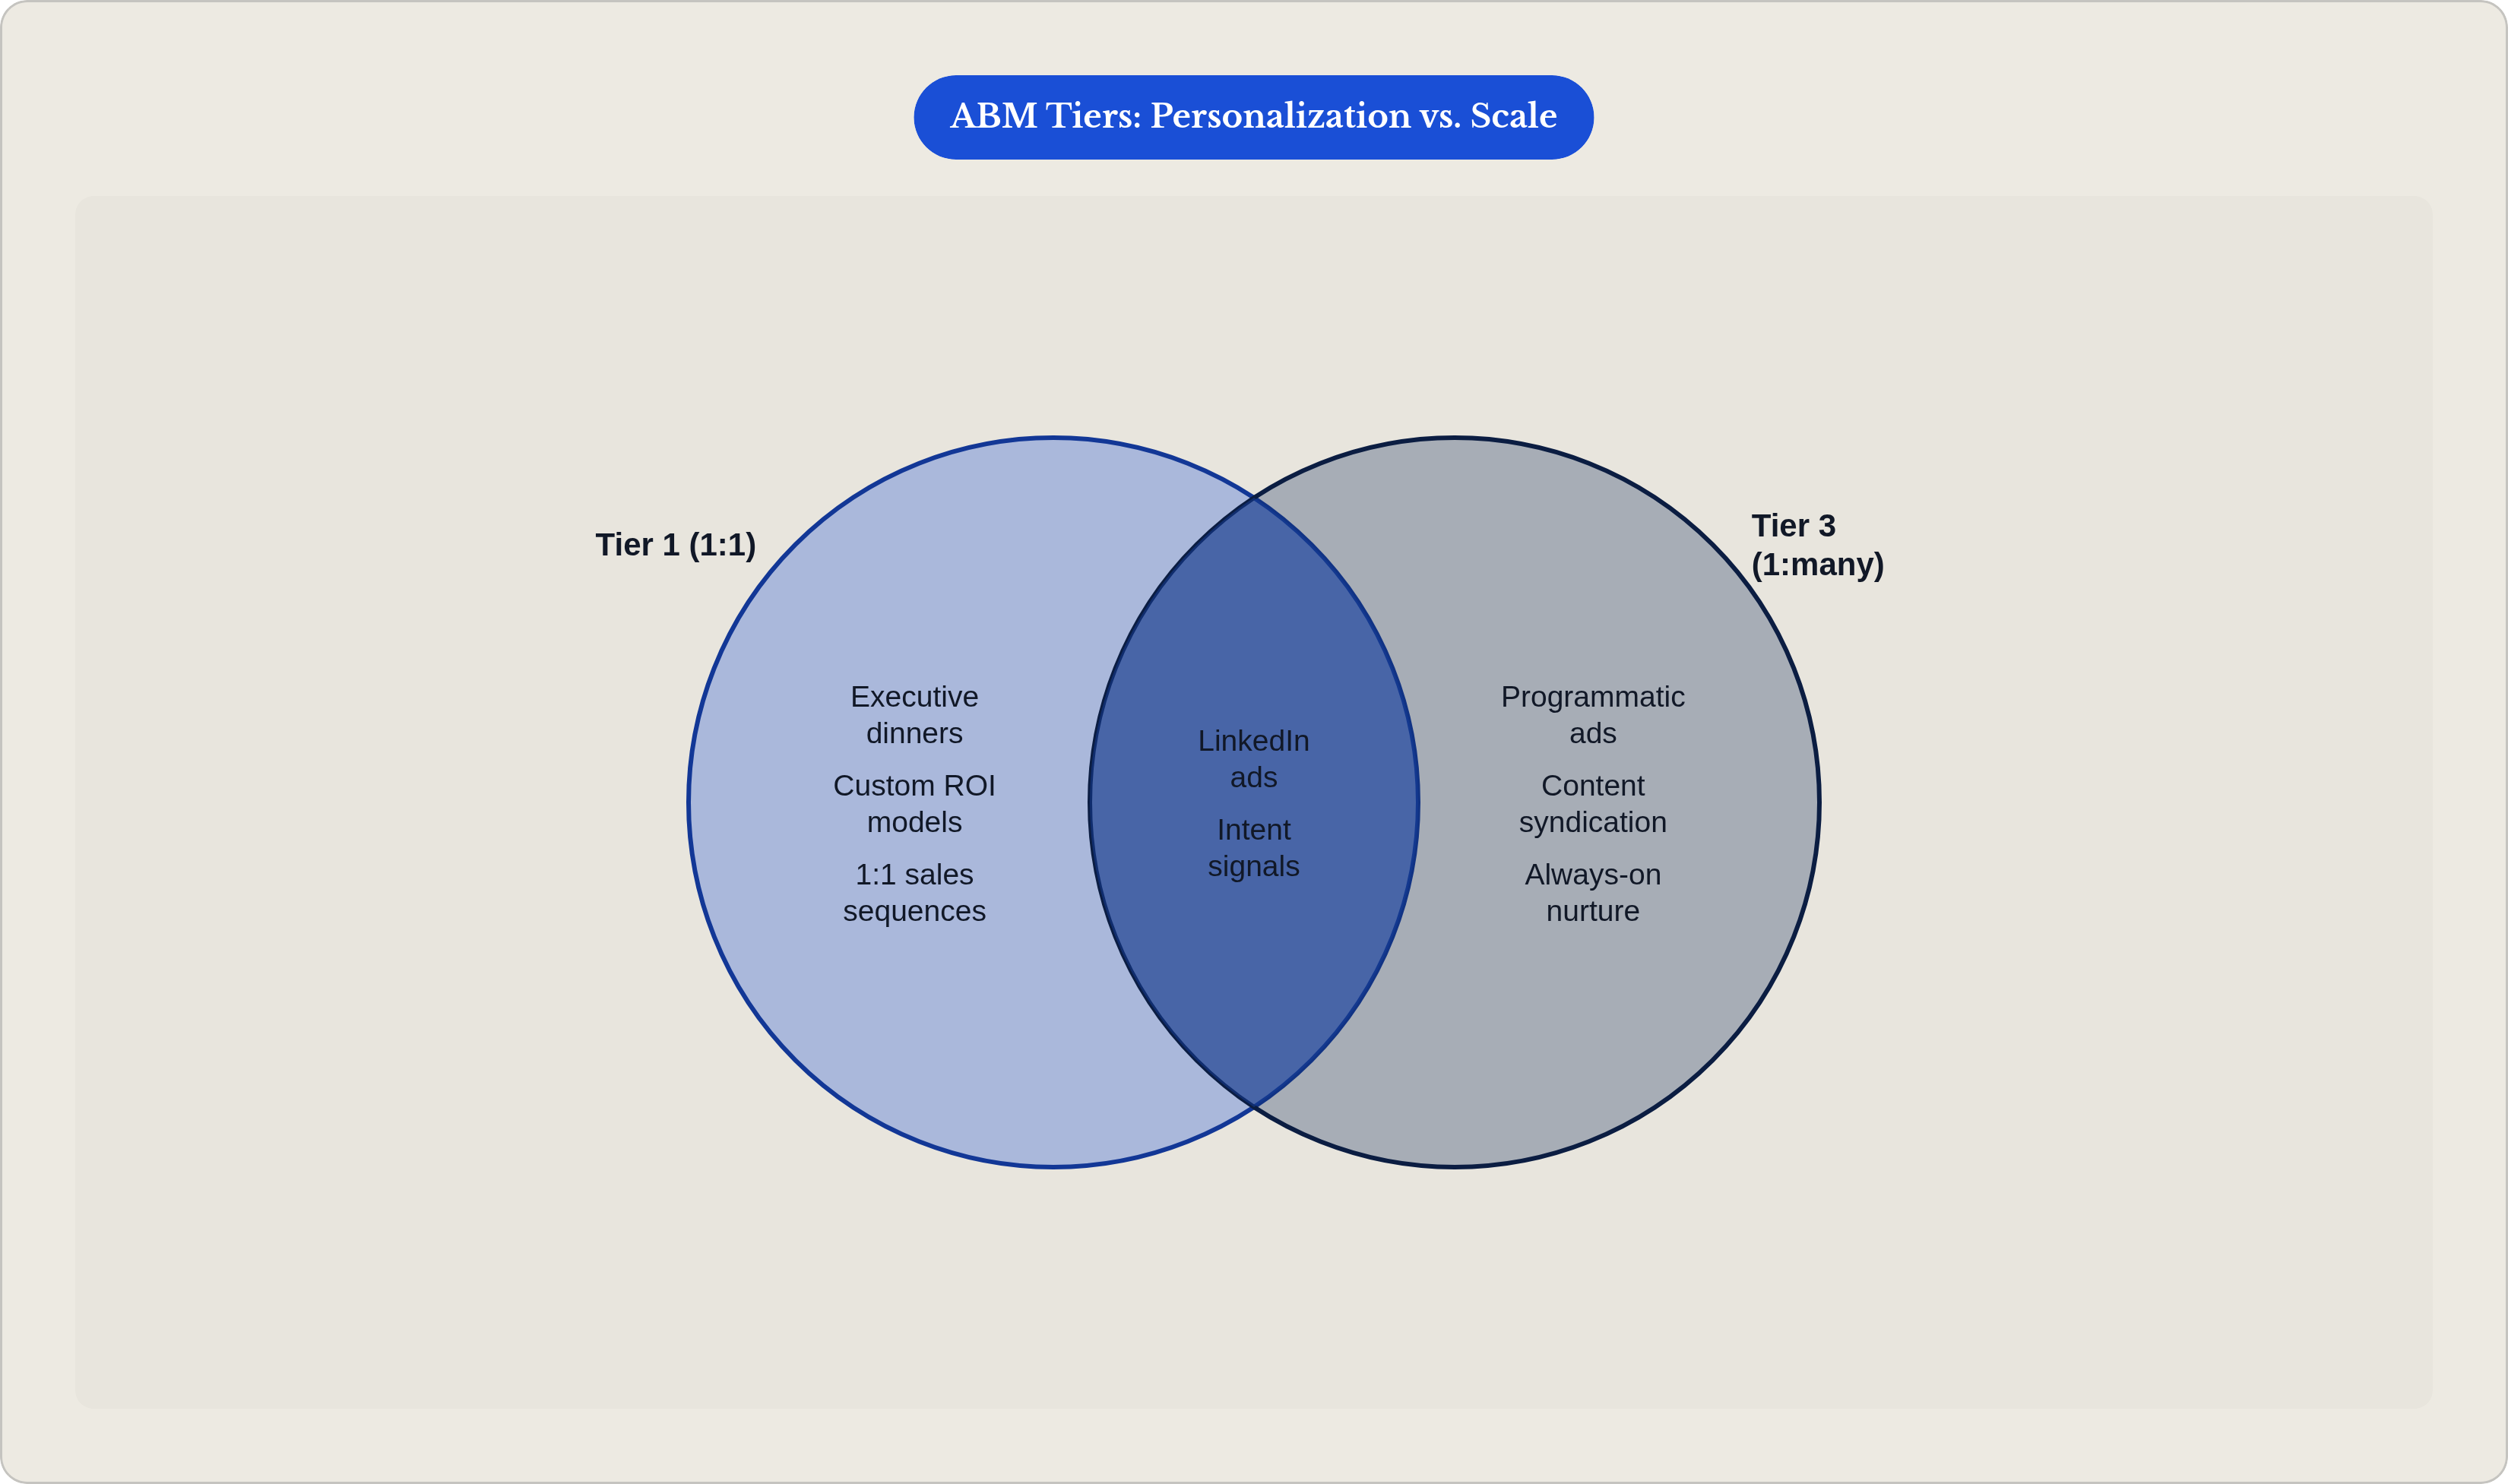
- Tier 1 (1:1): your best-fit, highest-revenue accounts, treated individually. Small list, usually a few dozen max.
- Tier 2 (1:few): strong fit, grouped by shared industry or use case. Personalized at the segment level, not the name level. Dozens to low hundreds of accounts.
- Tier 3 (1:many): broad ICP match, run programmatically. Hundreds of accounts, functioning as a feeder that promotes accounts up once intent signals show up.
What decides where an account lands? Fit score, revenue potential, strategic value (does this logo help you close the next ten deals just by existing), and current buying-stage signals, blended together.
This is also where budgets quietly die if nobody draws a line. Tier 1 deserves sales, marketing, and customer success all pulling the same direction. Tier 3 can run almost entirely on autopilot. Treat them the same and you'll overspend on accounts that were never closing, or starve the ones that actually were. Both outcomes burn out your team, just on different clocks.
Template component: account scoring matrix. Weight your fit dimensions (firmographic, situational, behavioral). Set the signal thresholds that trigger a tier promotion or demotion. Size each tier against your actual team capacity, not your quarterly ambitions.
Tiering isn't one-and-done, either. A Tier 3 account showing sudden intent should move up. A Tier 1 account that's gone dark for three months shouldn't sit there forever, eating resources on hope alone.
Mapping the buying committee before running a single campaign
Enterprise sales cycles stretch to around 218 days, with mid-market deals running roughly 121 days. Teams that shrink that number work in parallel, engaging the whole committee at once instead of chasing one contact, waiting a week for a reply, then starting the next conversation cold.
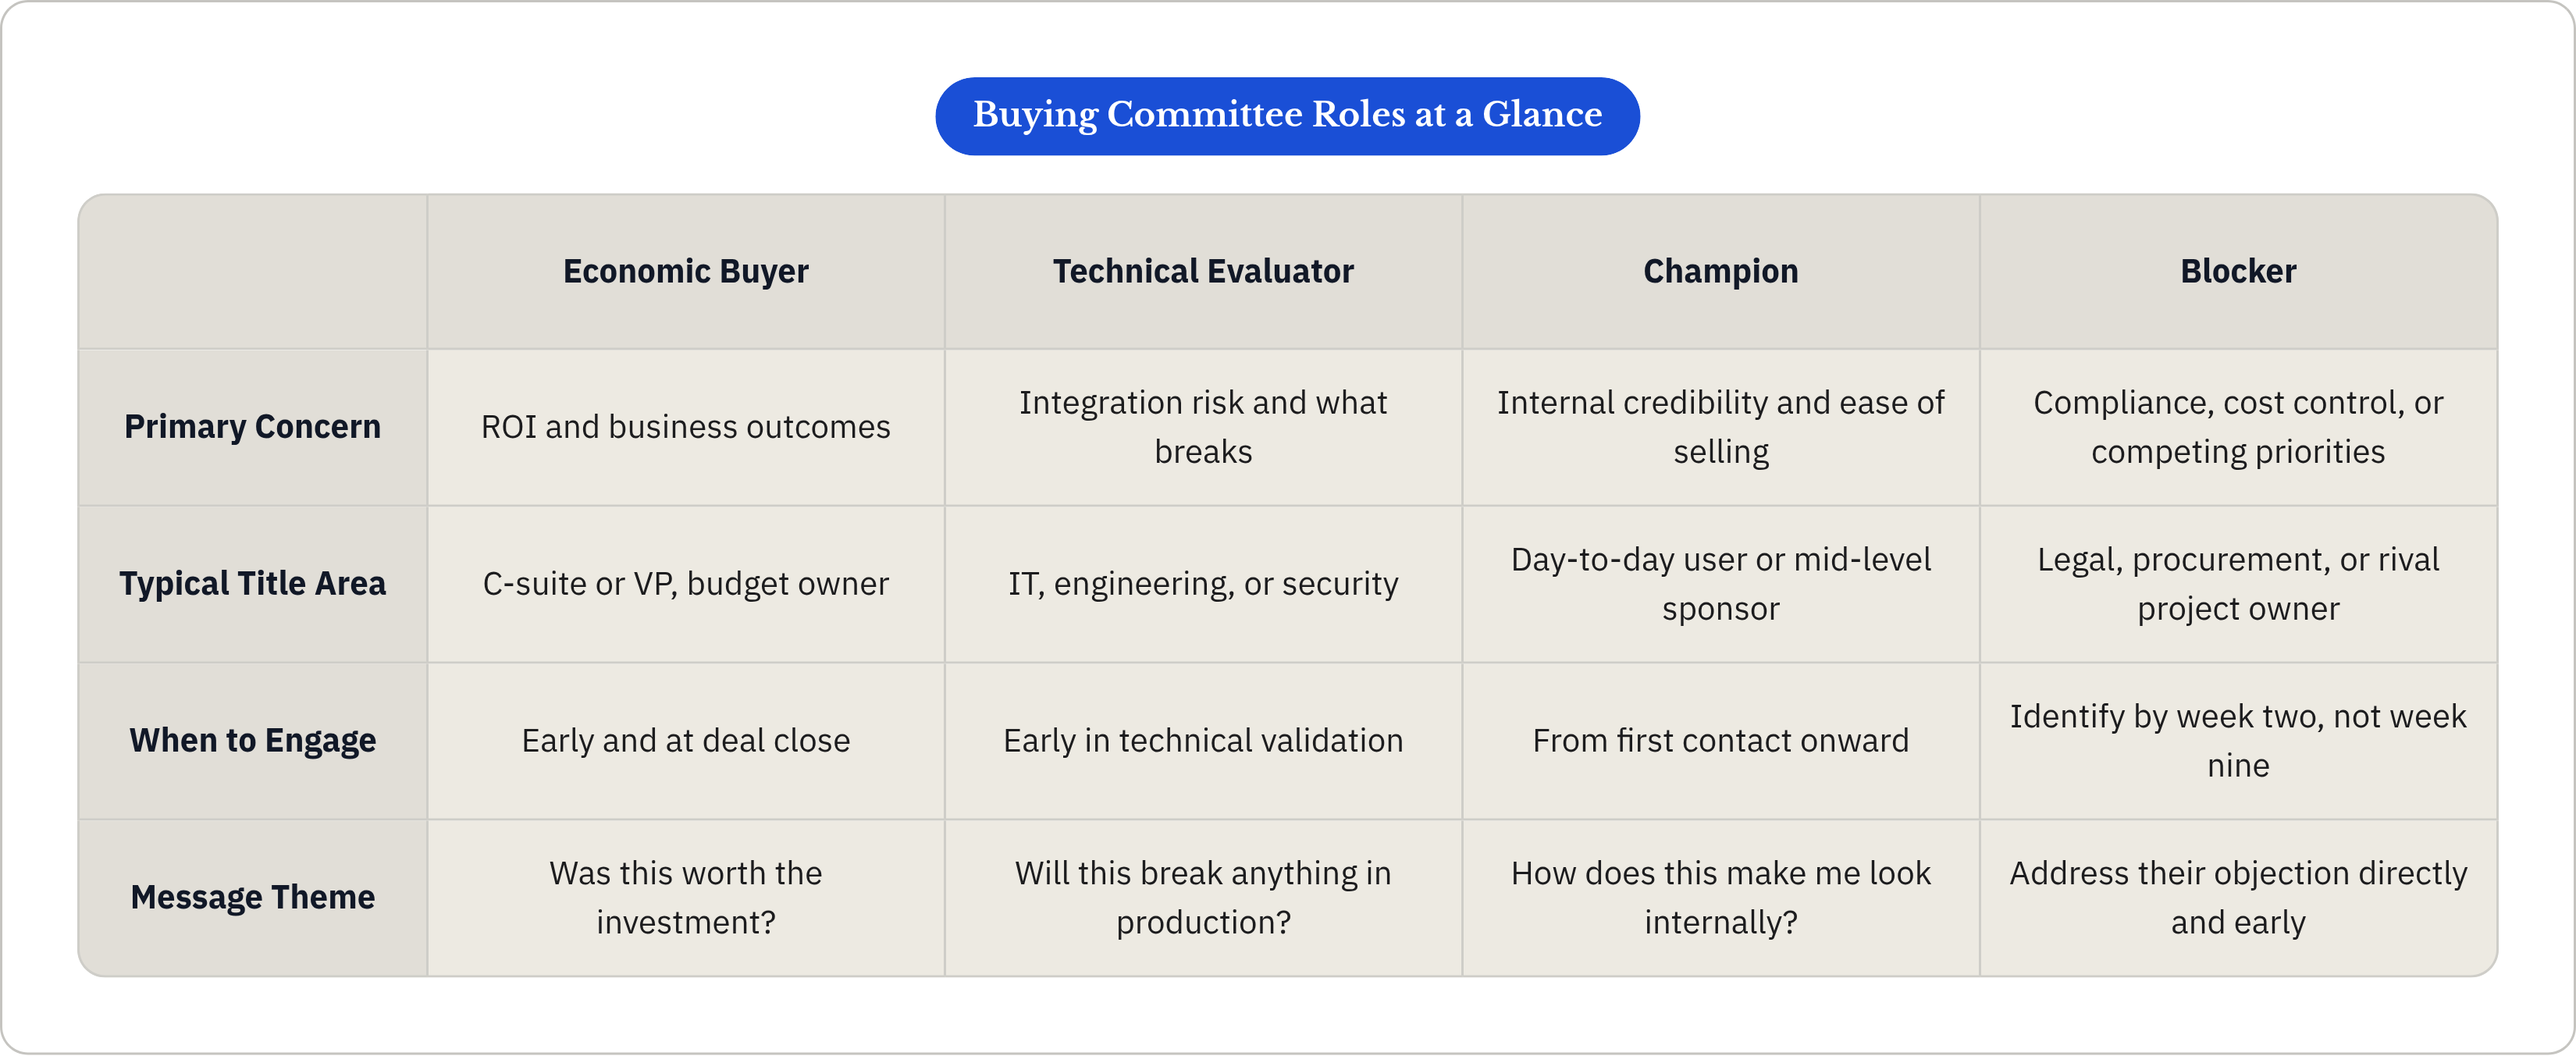
Four roles matter for every Tier 1 and Tier 2 account:
- Economic buyer: controls budget, cares about ROI and business outcomes
- Technical evaluator: assesses fit and integration risk, worried about security and what breaks during rollout
- Champion: your internal advocate, cares about how this makes them look and how easy it is to sell internally
- Blocker: often legal, procurement, or a competing internal project. Needs spotting in week two, not discovered in week nine
Building the map starts in your CRM: match the contacts you already have to the account. Layer in enrichment data for the titles you're missing, then use LinkedIn to confirm who actually holds those roles today and find your way in. Flag the gaps honestly. A Tier 1 account with no identified champion is a risk sitting in plain sight, not a minor footnote.
Messaging splits by role too. The technical evaluator wants to know if this breaks something in production. The economic buyer wants to know if this was worth the check. Send them the same email and you've built a newsletter, not an account-based campaign.
Template component: buying committee map. Track role, name, contact status (known or unknown), relationship owner (sales or marketing), engagement level, primary message theme, and a running coverage gap tracker.
Building the channel and content activation plan by tier
Channel mix shifts by tier. It doesn't stay flat across the whole list, no matter how tempting it is to just run one campaign and call it done.
Tier 1 gets direct, personalized sequences, executive events or 1:1 dinners, custom ROI models built for that specific account, and LinkedIn engagement straight from sales reps and founders. Tier 2 runs on segment content, vertical webinars, targeted paid (LinkedIn, intent-triggered display), and landing pages personalized at the segment level. Tier 3 runs on programmatic ads, content syndication, gated assets, and always-on nurture.
Plenty of teams run a hybrid. Always-on inbound covers pipeline efficiency broadly, and the real ABM investment concentrates on Tier 1 and 2. The inbound layer is what surfaces the intent signals that eventually pull a Tier 3 account up into Tier 1 territory.
Founder-led content deserves its own line here, and it's usually missing entirely. 6sense's 2025 data found buyers complete 61% of their decision before they ever talk to sales. That research phase is where a founder posting something specific and credible on LinkedIn gets an account onto the shortlist before an SDR sends message one. For Tier 1 accounts where your stakeholders already follow the founder, the cycle compresses, because trust got built before anyone picked up a phone.
Content calendars follow the same logic: account-specific content mapped to buying stage for Tier 1, shared pain-point content by vertical for Tier 2, category-level awareness content for Tier 3.
Template component: channel activation grid. Map tier, channel, personalization level, content type, owner (marketing, sales, or founder), and cadence.
The mistake that shows up constantly: running the same LinkedIn ad across every tier and calling the whole thing ABM. Reach without personalized follow-through is just demand gen with a shorter list and a fancier name.
Sales and marketing alignment: the operational layer most ABM plans skip
Only 36% of companies running ABM programs consider sales and marketing tightly aligned. Given how much rides on this one thing, that number is embarrassingly low.
Real alignment isn't a monthly status call where everyone nods. It's a handful of structural agreements both teams actually honor.
A shared target account list with tier definitions everyone agrees on, no side spreadsheets. Defined handoff triggers, so marketing knows exactly what signal (intent threshold, engagement score, committee coverage) qualifies an account for sales outreach. Sales SLAs specifying response time once a handoff fires. Shared vocabulary, because a "qualified ABM account" and an MQL are different animals, and treating them as the same thing produces pipeline reports nobody can trust.
SDRs play a different role here than in traditional outbound. In a program that's working, SDRs pick up warm signals marketing already generated, especially at Tier 1 and 2, instead of cold-calling into an account blind.
Template component: alignment agreement. Define who owns the shared account list and how often it gets reviewed. Write the handoff triggers down explicitly, don't leave them as tribal knowledge. Set sales follow-up SLAs by tier. Build an escalation path for Tier 1 accounts that go quiet.
When this alignment is real instead of aspirational, prospects move through pipeline noticeably faster, because sales and marketing touchpoints reinforce each other instead of stepping on each other's toes. That's the actual mechanism behind the ROI numbers ABM programs report: plain coordination between two teams working off the same data, nothing more mysterious than that.
Measuring ABM on the metrics that reflect pipeline, not activity
Only 52% of companies measure ABM's ROI at all. That means roughly half these programs run on faith, with nobody able to defend the budget or diagnose what's broken.
Standard demand gen metrics fail here for a simple reason: they measure the wrong thing. MQL volume says nothing about how deep you've actually gotten into an account. Impressions and click-through rates don't tell you whether you've reached the blocker yet. Cost-per-lead comparisons actively punish ABM, since ABM is built on purpose to produce fewer, bigger opportunities. Comparing it to volume-based demand gen on cost-per-lead is like comparing a scalpel to a leaf blower and asking why the scalpel didn't move more air.
Four metrics actually track to pipeline. Pipeline influence rate: what share of closed deals had ABM touchpoints across the whole committee, not just one contact. Sales cycle velocity: are ABM-treated accounts closing faster than comparable accounts that weren't touched. Win rate on target accounts: ABM Leadership Alliance and Demandbase data from 2026 puts ABM-led programs at 41% higher win rates and 33% larger average deal sizes at close. Buying committee coverage: how many mapped roles at each Tier 1 account has the program actually reached, since gaps here are early warnings, not a footnote you fix later.
There's a timing trap worth naming directly. ITSMA's 2024 Benchmark Study puts median time from ABM launch to mature performance at 18 months. Check results at month four against mature-program benchmarks, and you'll conclude the program failed right before it was about to compound. That's not a measurement problem, it's a patience problem wearing a measurement costume.
While pipeline data is still thin, three proxy metrics carry the weight: account engagement score trend, committee coverage rate month over month, and marketing-sourced pipeline from the target account list specifically.
Template component: ABM measurement dashboard. Track tier, account, committee coverage percentage, engagement score, pipeline stage, days in stage, and next action owner. Roll it up at the program level with pipeline contribution, win rate against a non-ABM baseline, and average deal size against that same baseline.
Putting the full template into motion: sequencing the first 90 days
Don't turn channels on until the ICP, the tier list, and the Tier 1 committee maps are locked. Outreach before the groundwork exists just makes noise, and noise is expensive to clean up after the fact.
Days 1 through 30: define the ICP, build the scoring model, then build and tier the initial account list. Complete committee maps for every Tier 1 account. Lock the sales-marketing alignment agreement in writing, not in a Slack thread that everyone forgets by Friday.
Days 31 through 60: build Tier 1 content assets and personalized sequences, then launch Tier 2 segment programs. Turn on the Tier 3 programmatic layer, and start the founder's LinkedIn cadence around the category content your ideal accounts are already reading.
Days 61 through 90: handoff triggers start firing for real, and sales activates on warm Tier 1 signals instead of cold guesses. Watch committee coverage and engagement score trends closely. Run the first account review, and start promoting or demoting tiers based on actual signal, not gut feel.
Early movement, climbing engagement scores, widening committee coverage, should show up somewhere in that 60 to 90 day window. Pipeline dollars from Tier 1 take longer, simply because enterprise deals take longer to close; that's the shape of the deal size you're chasing, not a crack in the plan.
For teams with a founder willing to post on LinkedIn consistently, the pre-sales warm-up starts on day one. It works quietly in the background while the rest of the machine gets built underneath it, and nobody notices it's working until a prospect mentions they've "been following along for a while."